
Ten schools departed the Pac-12 in 2024, primarily due to difficulties in securing an acceptable media deal. Originally given up for dead, the Pac-12 has rebuilt itself with scrappy, fast-growing schools and may end up as the sweet spot conference in the NIL and revenue sharing era.
| Pac-12 Conference Members 2026-27 | Year Joined | Prior Conference |
|
|---|---|---|---|
| Boise State | 2026 | Mountain West | |
| Colorado State | 2026 | Mountain West | |
| Fresno State | 2026 | Mountain West | |
| Gonzaga | 2026 | West Coast | |
| Oregon State | 1915 | Charter Member | |
| San Diego State | 2026 | Mountain West | |
| Texas State | 2026 | Sun Belt | |
| Utah State | 2026 | Mountain West | |
| Washington State | 1917 | Independent | |
 | |||
| Total Members | 9 |
The new Pac-12 will be a “unicorn” conference composed of the better elements of the Power 4 and Group of 5 conferences. It will have a lower operating cost structure similar to the group of 5, but with media exposure, athletic competitiveness and school visibility closer to the Power 4. Pac-12 schools will likely compete successfully on a national scale without having to go all in on the intercollegiate financial arms race.
The new Pac-12 will be highly competitive in football:
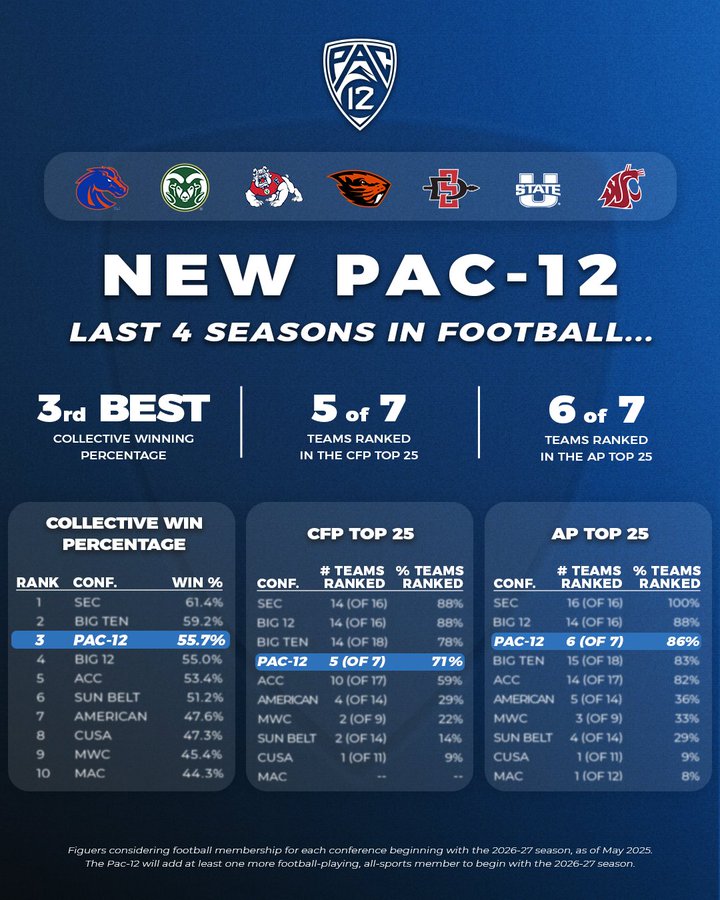
* Graphic produced prior to the addition of Texas State
And really competitive in Basketball: Seven of the nine Pac-12 teams have made the NCAA Men’s Tournament the past five seasons, including appearances by both Gonzaga & San Diego State in the National Championship game – the only two west coast schools to make the finals in the last 20 years:

* Graphic produced prior to the addition of Texas State
And in baseball: Oregon State (along with LSU) has won more NCAA baseball championships (3) than any other school in the past 20 years. The Pac-12 is also ranked 3rd nationally in the percentage of teams earning NCAA baseball tournament bids:

It’s pretty clear that Pac-12 teams will compete successfully with Power conference teams on the fields and courts. What the Pac-12 schools won’t have are the massive and ever-increasing budgets required to compete in the Power conferences. Many schools in the Big Ten and SEC now have athletic budgets of over $ 200 million per year … and this is before revenue sharing and related costs adds another $ 25 million to most Power 4 School budgets this year. Conversely, Pac-12 schools will operate on annual budgets that are over $ 100 million less than the average Power 4 Conference school:
| 2025 Annual Operating Expenses FBS Conference Averages ($) | Per NCAA Reporting | Per EADA Reporting |
|
|---|---|---|---|
 | |
||
| SEC | 224,947,226 | 208,234,404 | |
| Big Ten | 194,248,880 | 179,704,868 | |
| ACC | 169,270,445 | 165,140,288 | |
| Big 12 | 131,669,516 | 130,364,327 | |
| Pac-12 | 76,619,213 | 65,423,106 | |
| American | 63,666,350 | 62,183,968 | |
| Mountain West | 51,090,956 | 51,090,956 | |
| Sun Belt | 46,169,525 | 41,008,367 | |
| Mid-American | 41,970,787 | 40,371,612 | |
| Conference USA | 41,283,623 | 41,539,667 | |
 | |||
| Power 4 Average ($) | 182,947,702 | 170,952,831 | |
| Pac-12 Average ($) | 76,619,213 | 65,423,106 | |
| Annual Difference ($) | 106,328,489 | 105,529,725 |

The Sweet Spot – the new Pac-12 will likely deliver the most bang for the buck in the NIL era:
Let’s use a simple return on investment (ROI) calculation, to see which conference produces the most bang for the buck. Basketball is a good example since there is an easily quantifiable metric which virtually every NCAA I school has as an objective – a bid to the NCAA basketball tournament. We allocated 15% of the average EADA budget above (the same percentage as team specific revenue) to arrive at a conference wide investment in basketball. We divided this investment by the number of adjusted NCAA tournament bids per conference for the past 3 years and arrived at the following results:
Average cost of an NCAA
Tournament Bid 2024-26Total
TeamsTotal Bids
2024-26Adjusted
Bids *At-Large
BidsAverage Cost per
At-Large Bid ($)Average Cost
All Bids ($)

Pac-12 9 12 11 8 33,120,447 24,087,598
Big 12 16 25 25 22 42,664,689 37,544,926
SEC 16 32 32 29 51,699,576 46,852,741
Big Ten 18 24 24 21 69,314,735 60,650,393
ACC 18 17 17 14 95,545,452 78,684,490
Mid-American 12 4 4 1 218,006,704 54,501,676
Mountain West 10 6 4 1 229,909,304 57,477,326
American 13 4 4 1 363,776,212 90,944,053
Conference USA 10 3 3 - n/a 62,309,501
Sun Belt 14 3 3 - n/a 86,117,571
* Adjusted for effect of conference realignment on automatic qualifiers.
The new Pac-12 has the lowest average cost of a successful bid to the last three NCAA Basketball tournaments in both total bids (i.e. including automatic qualifiers) and in the more meaningful cost per at-large bid. Going forward, the smaller number of teams in the Pac-12 may work against it, however the addition of Gonzaga also significantly increases the strength of schedule metric the selection committee considers when determining tournament bids. But the bottom line remains clear, the new Pac-12 will be a seriously good basketball conference that will likely continue to punch above its weight.
Just to compete within their respective conferences, virtually every P4 school is likely going to commit to the maximum revenue sharing payout of $ 21 million for 2026-27. Pac-12 schools will also be participating in revenue sharing, but it’s going to be at a fraction of what P4 schools pay. The surprising twist here is that the revenue sharing gap will likely not overly disadvantage Pac-12 schools, simply because they’ve always been at a recruiting disadvantage. Historically, all the schools in the new Pac-12 have had to compete and recruit against schools such as USC, UCLA, Washington and Oregon and rarely signed star recruits over these schools. Instead, they compete by finding value in lower ranked recruits and giving them the opportunity to succeed on a national stage.
A Tale of Two Schools …

When ten schools departed the Pac-12 in 2024, there was a fair amount of speculation about the two castaways – Oregon State and Washington State. How would they fare going forward? Many so called experts opined that the demise of the old Pac-12 would be a death sentence to Beaver and Cougar recruiting efforts. But composite recruiting data shows that both schools recruiting rankings have remained virtually unchanged:
Composite FBS Football
Recruiting Ranking2024 2027
Washington State 62 64
Oregon State 70 73
What’s impressive about the stability of these recruiting scores, is that they encompass a very turbulent 3-year time period when both football teams each experienced two coaching turnovers, as well as valid speculation as to whether the Pac-12 would even continue to exist. What’s not reflected in the composite recruiting scores, is that the Beavers and the Cougars will likely have closed the gap in competitiveness with the schools ranked ahead of them. This is due to newly instituted roster caps on NCAA I sports included in the House v NCAA settlement.
For FBS football, the new roster limit is 105 players, all of whom are eligible for a full scholarship (the prior limit was 85 scholarships). Since Power 4 schools had an average football roster of 130 players prior to the House settlement, this means there are around 1,700 additional players otherwise on a Power 4 roster likely looking for a school to play at:
Effect of NCAA Roster Caps on
Power Conference football teams:
Average Power 4 Football Roster 130
New FBS Football Limit 105
Average number of players above cap 25
Total number of Power 4 Schools 68
Number of available Power 4 caliber Players 1,700
This is a significant recruiting windfall for Pac-12 schools (as well as other Group of 6 and FCS teams) due to the cascading effect of available talented players. What Group of 6 team wouldn’t seriously consider recruiting a football player talented enough to otherwise be on say a Notre Dame, Michigan or Alabama roster?

For Pac-12 schools, the benefits are especially clear with respect to local recruiting. If Oregon must operate with 25 fewer players, Oregon State is a short drive up I-5. If Washington must operate with 25 fewer players, Washington State is just over the mountains. If Southern Cal and UCLA must each operate with 25 fewer players, San Diego State and Fresno State are both close by.
Pac-12 schools are also subject to roster limits, but due to the cascading effects of the talent pool, the net result is that their 105 player teams will likely be of a higher overall talent than they were prior to roster limits. And this was one of the primary objectives of the new framework … to prevent big budget schools from stockpiling talented players on oversized rosters in the NIL & revenue sharing era.
A recent study published by researchers at Carnegie Mellon and UT Dallas also came to the conclusion that NIL & revenue sharing will result in a more competitive balance between schools due to a wider distribution of talent across college programs. The study is especially compelling as it challenges several conventional assumptions about the competitive balance in intercollegiate athletics.
What has changed dramatically since 2024 is the cost to recruit and assemble a college football team. Oregon and Washington left the Pac-12 for the Big Ten where the average football roster cost is close to $ 25 million per team. Conversely, Oregon State and Washington State compete in a conference where average roster costs are less than $ 5 million, and will likely end up with football teams that are more competitive than they were prior to the implementation of roster limits. There is also a significant difference in athletic department payrolls between the two conferences. Big Ten Schools on average pay three times what Pac-12 schools pay in both Football and Men’s Basketball, and an average of $ 46 million per year more in total payroll:
Avaerage Salary Costs per
NCAA Reporting 2024-25Big Ten Teams ($) Pac-12 Teams ($)
Football Head Coach 7,953,219 2,098,798
Football Assistant Coaches 9,237,918 4,191,549
Football Support Staff 6,211,297 1,648,592
Total Football Salaries 23,402,435 7,938,939
Basketball Head Coach 5,203,625 1,557,061
Basketball Assistant Coaches 2,081,722 942,305
Basketball Support Staff 817,055 277,896
Total Men's Basketball Salaries 8,102,403 2,777,262
Total Athletic Department Payroll ($) 72,994,659 26,193,141
But schools with modest payrolls and reasonable coaching salaries can compete with the big budget boys. In 2024 Washington State beat Washington … less than a year after the Huskies appeared in the NCAA Championship game. In the 2025 season the Cougars nearly upset 4th ranked Ole Miss and 18th ranked Virginia, losing by a combined 5 points. They played both these games with a first-year head coach along with 20 FCS transfers. In each season Washington State received a post-season Bowl invitation as well.

I’ll go out on a limb and say that being abandoned by the other ten schools may end up being a very timely gift to both the Beavers and Cougars. They did take a hit in revenue, but not as big as many people seem to think. The final Media offer before the old Pac-12 splintered (ten schools at the time) was a $ 23 million streaming deal from Apple TV. The new Pac-12 media contract is somewhere around $ 10 million annually, but it’s a linear TV contract and includes national broadcasts. So around $ 13 million less in media revenue than a streaming contract that was never going to happen anyway. But the end result is that both schools are in a highly visible and competitive conference in which operating costs are over $ 100 million per year less than the average P4 conference school. Maybe it’s just the accountant in me but if I’m offered a choice of these tradeoffs, it’s pretty obvious which is better financially.

But let’s say the opposite happened and both schools had actually received an offer to join the Big Ten … what would the likely result be? I think both schools would have followed the dismal experience of Rutgers. Since joining the Big Ten, the athletic department at Rutgers has run up massive deficits including a 2025 operating loss of $ 88 million. And this is before revenue sharing and related expenses will add another $ 25 million or so in new costs in 2026.
And what’s the benefit to the school in incurring all this red ink? To have lower tier teams and the lowest booster support in its conference? To create ongoing tension among university staff who see their academic budgets cut, while athletics seemingly gets a blank check? And Rutgers is running up these deficits with a full share of conference media income ($ 65 million) … if Washington State or Oregon State had received an offer it would have been for a fractional – or zero – share. Joining the Big Ten would have been a financial disaster for these two schools.
And that’s where the rub comes in. More money doesn’t necessarily solve problems, as Rutgers shows it may simply make those problems bigger. I’m not trying to pick on Rutgers … they are simply paying the price of admission to a conference where costs are rapidly accelerating. And they’re not alone. There are a number of schools nationwide that may be on the road to financial perdition, including both Maryland and UCLA in the Big Ten. Not coincidentally, these three coastal schools also reported the lowest booster support in their conference:
Booster Contributions
Big Ten 2024-25 ($)Loss from
OperationsContributions
2024-25 ($)
Surplus/
Deficit ($)
Ohio State -60,760,319 68,955,032 8,194,713
Penn State -49,676,159 64,557,754 14,881,595
Washington -73,929,573 52,876,796 -21,052,777
Illinois -60,347,942 50,720,205 -9,627,737
Michigan -47,417,369 50,362,101 2,944,732
Nebraska -42,239,204 48,407,981 6,168,777
Michigan State -47,212,968 36,980,159 -10,232,809
Iowa -36,047,974 35,071,275 -976,699
Oregon -31,522,008 33,164,614 1,642,606
Purdue -29,991,692 27,693,151 -2,298,541
Indiana -43,965,645 26,431,033 -17,534,612
Wisconsin -31,234,783 26,219,033 -5,015,750
Minnesota -33,460,640 22,376,553 -11,084,087
UCLA -58,941,837 13,478,195 -45,463,642
Maryland -36,053,435 11,311,080 -24,742,355
Rutgers -88,510,564 8,122,577 -80,387,987
Average per School ($) -48,207,007 36,045,471 -12,161,536
All College athletic departments run operating deficits. These deficits are ultimately covered by a combination of booster contributions, school funding and student fees. For example, Texas spent by far the most money on athletics in 2025, but also received $ 171 million in booster contributions. In the Big Ten, schools like Ohio State, Michigan and Penn State have historically received enough booster support to cover 100% of their operating deficits. But Rutgers is nowhere close. Its operating loss last year was $ 88 million with only $ 8 million of booster contributions … so a shortfall of $ 80 million that is ultimately paid by the school and its students. With revenue sharing and additional scholarships likely adding another $ 25 million in new costs this year, Rutgers annual net deficit could approach $ 100 million.
But it’s going to be increasingly difficult for athletic departments to continue to tap school general funds or student fees to cover growing deficits. Federal funding cuts and declining college enrollment are placing an enormous financial strain on universities nationwide. It will be difficult for schools to rationalize academic department cuts and staff layoffs, while at the same time giving money burning athletic departments a seemingly blank check to pay teen-age football and basketball players millions of dollars per year.
Like many schools, Rutgers, Maryland and UCLA are experiencing what the lack of booster support means in the NIL era if you are competing in a big budget league. Per NCAA reporting, these three schools 2025 booster contributions were actually lower than the average contributions for Pac-12 schools … who operate with much lower budgets. Here is a summary of average booster support by conference:
Booster Contributions
by Conference 2024-25Average per
School ($)Increase
2022-25
SEC 65,842,515 134%
ACC 38,091,667 42%
Big Ten 36,045,471 60%
Big 12 34,806,296 181%
Pac-12 14,711,934 178%
American 7,774,888 36%
Mountain West 5,527,785 9%
Sun Belt 5,240,123 52%
Conference USA 2,503,917 32%
Mid-American 2,335,113 49%
P5 Average ($) 40,511,245 102%
G5 Average ($) 4,532,667 34%
While joining a bigger budget conference may work to a school’s overall benefit, you still need to be able to afford it. College sports is often referred to as the “front porch” of a school … not the most important room in the house, but very often the most visible. Athletics account for substantially less than 10% of an FBS school’s total budget but might represent 90% of the optics. Intercollegiate sports is an extremely effective tool in marketing a school nationwide.
In business this is called branding, and the objective is to sell more of your product. “Branding” is also what many schools tout as a justification for massive spending on athletics. But there is also a law of diminishing returns, and over the top spending on athletics rarely results in proportional returns in key metrics such as say, first-time / freshmen enrollment. And that’s one of the most interesting twists with the new Pac-12. Its schools already average the highest enrollment growth rate of any FBS conference:
| FBS Conference Schools 20-year Growth rate * | Average Enrollment | Increase 2004-24 |
|---|---|---|
| Pac-12 | 24,704 | 73% |
| SEC | 33,517 | 63% |
| Big 12 | 31,627 | 53% |
| Big Ten | 39,371 | 46% |
| American | 20,298 | 41% |
| Sun Belt | 13,180 | 41% |
| ACC | 23,580 | 32% |
| Mountain West | 16,206 | 30% |
| Conference USA | 21,140 | 29% |
| MAC | 16,548 | -1% |
| Median Enrollment | 22,024 | 42% |
* Percentage Increase is for first-time degree seeking undergraduates enrolling in the fall term, for the 20-year period 2004 to 2024. Data source is the National Center for Education Statistics of the U.S. Department of Education. Average enrollment per school is total full-time, Fall 2024. The three FBS service academies have been excluded from conference averages.
So if I’m a current Pac-12 school, what’s my tangible benefit in “moving up” to a conference whose schools average a lower rate of enrollment growth? And don’t give me some hazy allusion to an “elevated research profile” because there is virtually zero supporting data for that … the top funded research university in the US the past 50 years is an NCAA Division III school.
Show me the money. Because it’s going to cost me an additional $ 100 million or so per year just to be on an average budgetary level with my new P4 league rivals … those dollars going out the door are definitely tangible. But since I’m likely not getting any material increase in my share of media income, looks like that $ 100 million is all on me. And without a doubt, all that new spending will royally piss off that pesky academic and research side of my school … and maybe some state legislators as well. And to top it all off, I’ll almost certainly end up with a reduced chance of ever making the CFP or receiving an NCAA Basketball Tournament bid. Hmmm …

From a data perspective, it’s a pretty compelling case that the current Pac-12 schools are already in the sweet spot conference. They don’t need to max out on a $ 21 million revenue sharing commitment (which will increase to $ 49 million per year if the Protect College Sports Act becomes law) or field football teams with $ 25 million payrolls just to be competitive. They don’t need to compete with conference rivals who pay football coaches $ 12 million per year, or have $ 14 million locker rooms with golf simulators and bowling alleys. They are not in a conference with an ever-escalating financial arms race among its own members.
Instead, they will compete in the new Pac-12. A conference composed of schools that actually make geographical sense being together. Schools with sensible budgets, but also schools that will be able to compete and promote themselves effectively on a national scale. And none of the Pac-12 schools will ever have to justify to their students, boosters, fans, faculty and alumni, why they left a conference where they were successful, to become part of a distant conference where they will likely see less success, but with much higher and ever-increasing cost commitments.
We didn’t just make this stuff up … see our page on methodology and sources of information. Questions on our data? Contact us at: NIL-NCAA.com Statistics compiled & edited by Patrick O’Rourke CPA, Washington, DC 